What is the Moving Average Convergence Divergence (MACD)?
Technical analysis requires the use of tools known as technical indicators. There are many of them out there, but technical analysts use some more often than they do others. One of the most important of the indicators is the Moving Average Convergence Divergence (MACD).
In this article, we will examine what the MACD is, what it is used for, the advantages and disadvantages of using it among many other things. We will also try to compare it to similar other indicators and also talk about how relevant it is in doing technical analysis.
MACD explained
For us to understand MACD, we need to understand what Moving Average is. Moving Average is the average price of an asset (cryptocurrency in this case) over a period of time. Simple Moving Average for instance is just the summation of the prices for X number of days or hours, divided by the number of days of hours.
Technical analysts sometimes use more than one moving average on the same asset during analysis. While this is not exactly two different MAs, it basically is used to examine the relationship between two moving averages. When used properly, it can reveal not just the direction of the trend of an asset, but also reveals the strength, momentum and how long the trend will last.
The MACD can be obtained by subtracting the 26-period Exponential Moving Average (EMA) from the 12-period EMA. This is however plotted automatically using a charting platform like TradingView, therefore you don’t have to learn the maths behind it. When plotted like that, a signal line is also plotted above the MACD. This is basically a nine-day EMA of the MACD.
Below is a daily BTC/USD chart we will use for illustration.
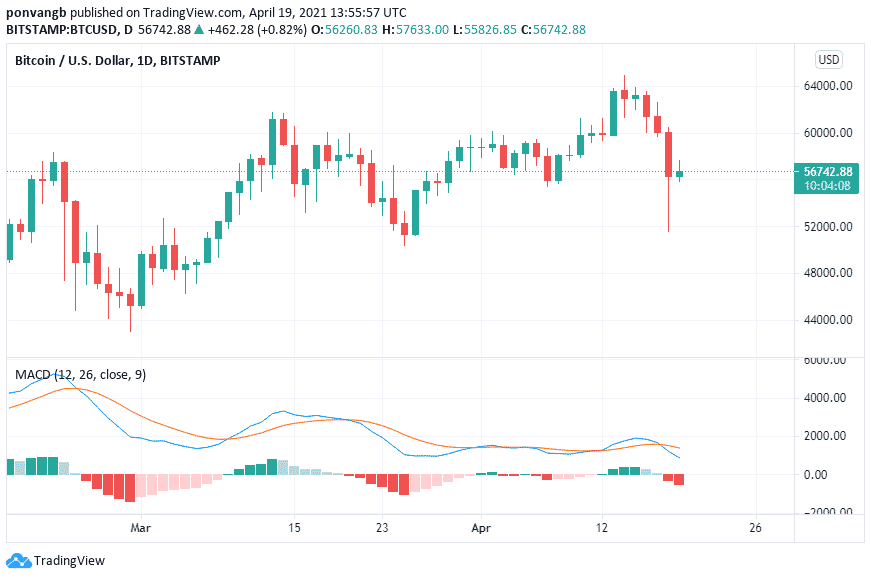
The two lines below the price are the MACD (blue) and the trend line (orange) which is the nine-day EMA pd the MACD.
How to use MACD?
The Moving Average Convergence Divergence (MACD) is used mainly to detect trend changes in the price of an asset. Let’s say Bitcoin has been trending upward and a trader wishes to place a trade, but is unsure of whether to place a buy or sell order. He can easily grab his MACD indicator and have a quick look at what is going on.
Like the chart above, he only needs to look at where the MACD is relative to the trend line. If the MACD crosses above the trend line, that is a buy signal. If it crosses below the trend line, it is considered to be a sell signal. So for example, the MACD recently crossed below the trend line. What this means is that there was a trend reversal from a bullish one to a bearish one.
A trader watching the Moving Average Convergence Divergence for this chart at the time would have sold his position. He will then wait for the MACD to cross back up again as a buy signal and he would place a buy order.
The histograms below the MACD and trend line indicate how strong the trend is. If the histogram lines are longer (whether upward or downward, green or red) it means the trend is bigger and vice versa. The lower the red goes below the 0 point, the stronger the bearish momentum and the higher the green histogram goes above 0. The stronger the trend.
When to use Moving Average Convergence Divergence?
Being a trend-following momentum indicator, the MACD uses past trends in the price of an asset to give a clue of what will happen in the short term. It is also mainly known for showing trend changes. Therefore if you want to understand the current trend of an asset, the MACD is a good indicator to use. It is also very useful when looking for entry and exit points when trading, so you can depend on it to know when to buy or sell.
Which other indicator to the MACD use with?
Although MACD is a powerful indicator that can be used to gain insight into the market and make trading and investment decisions, it is not self-sufficient just like the others. Therefore to get the best out of MACD for technical analysis, you will need to combine it with other indicators.
The most commonly used ones are 20-period Simple Moving Average, Relative Vigor Index (RVI) and Awesome Oscillator (AO).
Advantages of MACD
The MACD is a very important indicator for determining when to buy or sell an asset. It gives the user an advantage as it tells them when to buy and when to sell their asset of interest. With the histograms, technical analysts can also tell how strong a trend is to help them make the right decisions. Perhaps the most important part of using Moving Average Convergence Divergence (MACD) is the fact that one can tell when there is a trend reversal, which is critical to knowing when to buy or sell an asset.
The indicators also give more updated information than moving averages. This makes it more reliable for studying the trends in an asset’s price.
Disadvantages of MACD
The use of MACD is highly subjective, which means the outcome can be very different for each user. The only way to master it, is to test your strategy repeatedly to be sure that a particular one works for you and stick with it.
Navigation