What is Moving Average?
There are important technical analysis indicators used by traders and investors to analyse the price behavior of an asset. In the cryptocurrency space, such indicators form a critical part of traders and investors strategy for making important investment decisions. One of the most commonly used of such is the Moving Average (MAs).
In this article, we will look at the moving average and the types, what they tell us, when they are useful, as well as which other indicators can be used alongside it. We will also examine the advantages and disadvantages of using moving averages for technical analysis.
Moving Average explained
In technical analysis, moving average is simply the average price of an asset over a period of time. This period can be long or short, like 10 days or 200 days, depending on the purpose. When doing analysis over a long period of time, a longer period MA may be required and the opposite is true for short term price analysis.
Generally speaking, MAs are calculated by simply taking the mean price for a period of time. For instance to get a 10-day Moving Average, you simply add up the closing prices for the last ten days and divide by the number of days, which is 10. There could however be some variations as we will see shortly, but MAs give us an idea of future price behavior by giving us an idea of how the price has acted within a time period in the past.
When and how to use the moving average?
Moving Averages are used to get an idea of price changes over time. For instance the moving average which is essentially the price over time could be higher or lower than the current price. If lower, it is a good sign, showing that the price is growing at a healthy pace. If the moving average is higher, it means the price isn’t making much progress and the average of prices from a certain period in the past is now higher.
The moving average can also serve as a support or resistance, an MA that is above the current price clearly becomes a resistance as prices hit it and comes right back down. On the other hand if it is below the current price then it is serving as a support below which the price cannot go at the time. However, when an MA serving as support crosses over the price, it serves as the start of a bearish trend. If an MA that was a resistance crosses under the price, it is a bullish reversal from a bearish trend.
Analysts sometimes use more than one moving averages, usually 50 MA and 200 MA, but the moving average can be as low as 5 days (5 MA). In a bullish condition, the 50 MA will be above the 200 MA as it is the average of more recent prices and should be higher if the asset is bullish.
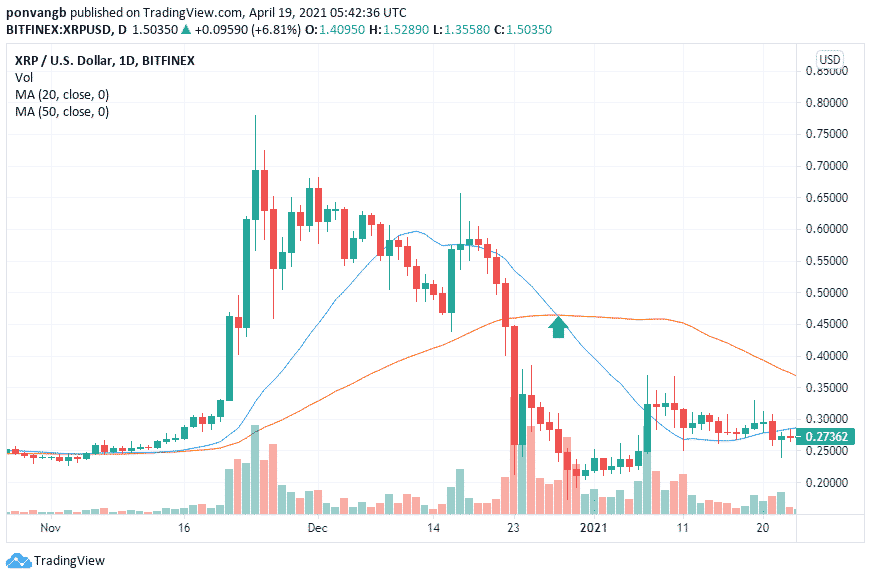
Consequently, if the 200 MA crosses above the 50 MA, it is referred to as a Death Cross as it shows a bearish trend reversal from a bullish one. The chart below is a daily XRP/USD price chart that illustrates the death cross as shown by the arrow.
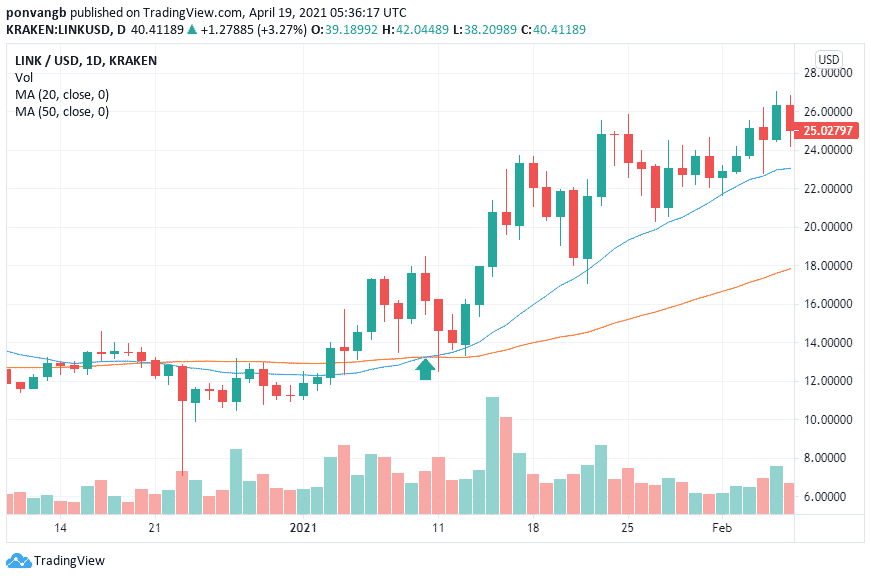
The 50 MA crossing above the 200 MA again is referred to as a Golden Cross. It shows that the asset is back in a bullish trend. This is considered to be a buy signal. Below is the daily chart for LINK/USD showing a golden cross indicated by the arrow. The 20 MA (a shorter time frame) crossed above the 50 MA (a longer time frame).
Other indicators to use with MA
Moving average when used alone can give a clue about market trends, but it does not provide sufficient information for a trader to make informed trading decisions. One indicator that can be used alongside Moving Average is the MACD which helps to shed more light on the moving averages, thus making the trends clearer.
There are types or variations of MA. although there are up to four types, we will only cover the two most commonly used types, namely Simple Moving Average (SMA) and Exponential Moving Average (EMA). These two vary in the way they are calculated and the suitability of their use depending on the interest of the technical analyst.
Simple Moving Average (SMA)
Also referred to as Arithmetic Moving Average, SMA calculation fits the general description given for MAs above. All you have to do is add up the closing prices for the last 10 days for instance and divide by the number of days (10). In SMA, the closing price for each day is given equal importance and relevance in the calculation, unlike the EMA as we will see.
Exponential Moving Average (EMA)
The Exponential Moving Average is calculated just like the SMA, but greater emphasis is laid on the more recent prices. This emphasis is called weighting, and it is usually greater for shorter term EMA than for longer term ones. To calculate the EMA for a 10-day period for instance, you have to wait till the tenth day to take the SMA. The SMA taken on the tenth day is then used on the 11th day as the first EMA for the 10th day.
Calculating the EMA requires a multiplier, given by the formula [2 ÷ (number of observations + 1)]. Therefore for a 10-day period, the value will be 2/(10+1)=2/11=0.1818.
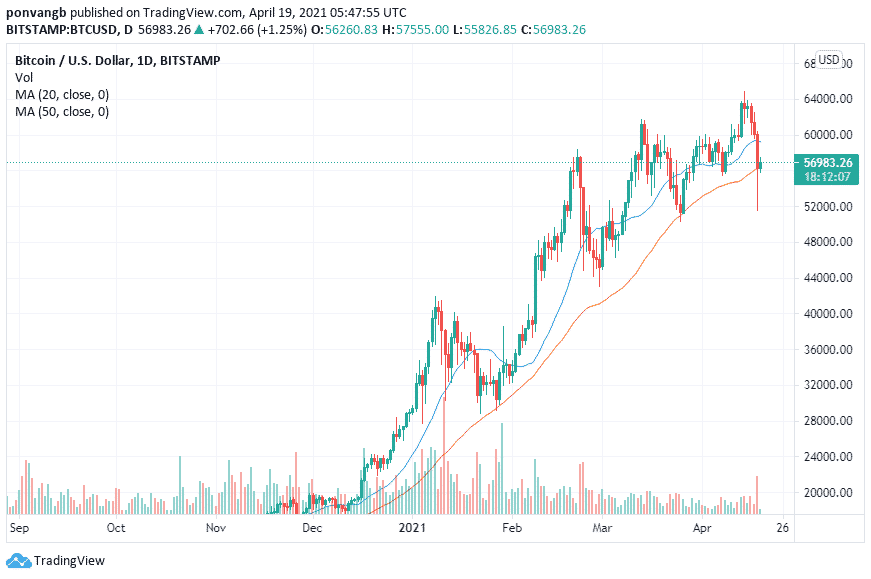
Now that you have your multiplier, you can then calculate your EMA using the formula Closing price x multiplier + EMA (previous day) x (1-multiplier). In this case, assuming we wish to find the 10-day EMA for BTC, whose closing price is $10,580 and the SMA on the 10th day is 10,320, we will have:
EMA = 10580 x 0.1818 + 10320 x (1-0.1818) = 1923.4 + 8443.8 = 10,367 as our EMA.
You can change the EMA by considering other values other than the closing price. You can use the open, high, low, or median price to get different results if you wish.
Which is better? SMA or EMA?
Having considered both SMA and EMA as types of moving average, the next logical question is, which of the two is better? The answer depends on the interest of the user.
For instance if you want very fast short term price information, EMA is best since it gives more weight to the most recent prices. The major disadvantage of using EMA is that because it focuses so much on the most recent price changes, the user may fall for a price spike thinking it is a breakout for example. This could lead to a potential loss for a trader.
However if you want a longer term analysis with a slower response to price changes, the SMA is more suitable. This is because it gives equal weight to all prices from which the SMA is calculated. The disadvantage of using SMA is that because it responds much more slowly to price changes, it can easily miss significant recent price moves which could be potentially profitable.
Navigation