What is a Fibonacci Retracement?
One of the most commonly used and also highly misunderstood technical indicators is the Fibonacci Retracement. While it can be very effective in deciding entry and exit positions in a market, it can also be very risky if not properly used. It is mostly used by advanced traders who have mastered the patterns and can use them efficiently to their advantage, but you can learn about it too.
In this article, we will discuss what Fibonacci Retracement is and in what scenarios they are most commonly used. We will also discuss the advantages and disadvantages of the indicator so that you know how to safely use it in future if you wish to.
So without any further ado, let’s dive right into it.
Fibonacci Numbers
Fibonacci Retracement uses a set of numbers called Fibonacci Numbers to try to show support and resistance levels in the price of an asset. These numbers were first introduced in Europe by a notable mathematician Leonardo Pisano (Fibonacci), hence the name given them. They were however already being used in India where they originated long before they were formally recognized.
The numbers form a sequence known as Fibonacci Sequence. Each number in the sequence being the sum of the last two numbers before it. They follow the pattern 0, 1, 1, 2, 3, 5, 8, 13, 21, 34, 55, 89, 144 etc.
Let’s not go into the mathematics, but these numbers have been used mainly in the field of computer science, but can be seen in nature such as the branching patterns in trees, the flowering of an artichoke and how a pine cone’s bracts are arranged. Obviously it is also used in technical analysis as we will see in this article.
Fibonacci Retracement
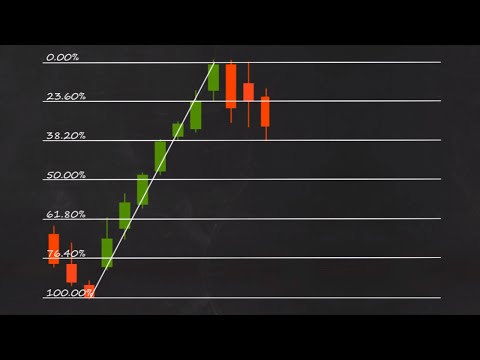
Having understood what Fibonacci numbers and sequence are, we will now look at the application in technical analysis. The numbers are used with Fibonacci Retracement to determine support and resistance levels. The retracement levels are 23.6%, 38.2%, 61.8%, and 78.6%. Some people add 50% which is not really a Fibonacci number, but can serve as a guide when the retracement falls midway between 38.2% and 61.8%.
To use Fibonacci Retracement, a pattern is drawn between a high and a low point. The numbers then show the support and resistance levels between those points. To illustrate, we will use the ETH/USD chart below.
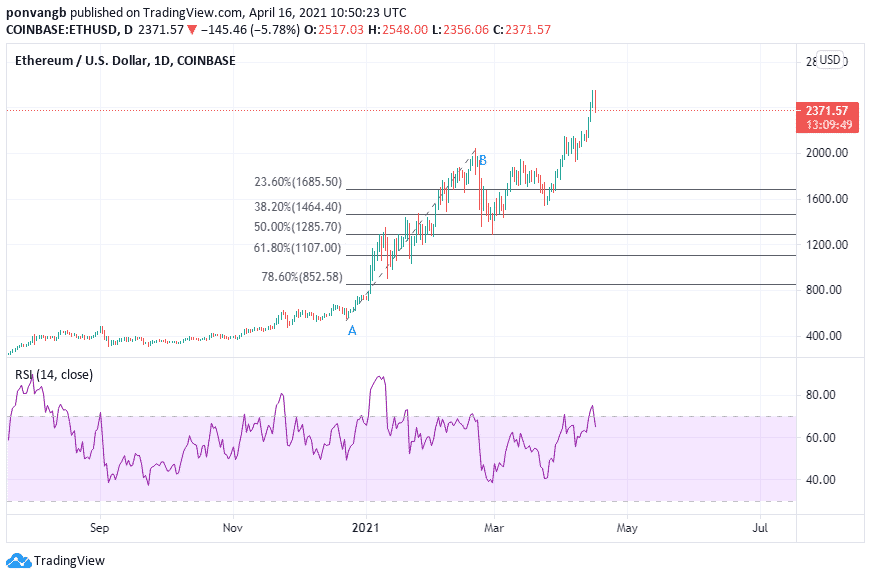
It is not the best setup, but we will just use it for illustration purposes. As you can see, the retracement was drawn from point A (low) to point B (high). The Fibonacci numbers are arranged in the middle from 23.6% at the top down to 78.60% at the bottom.
You can see that the price of ETH rose from A to B and then retraced to the 50% level. If ETH is in a clear bull trend (a requirement for using Fibonacci), it will make sense to buy Ethereum, because the bounce occurred at 50% which some traders say is very profitable even though it is not a Fibonacci number.
The ideal situation however is for the bounce to occur at a Fibonacci number, say 61.8%. This will then be set as the stop loss, below which the upward trend is not likely to continue. The take profit will then be set at the high coinciding with another Fibonacci number, say 23.60%.
This can also be used in a downward trend, but the pattern is reversed with the retracement being a bounce to a higher low.
Conditions for using Fibonacci Retracement
Fibonacci Retracemnent is an indicator like none other. Therefore there are a few conditions before it can be successfully applied. The first is that the market must be in a clear bull or bear trend. What this means is that the asset must have clear higher highs and higher lows in a bull trend and lower lows and lower highs in a bear trend. With such clear structures, the numbers can be easily applied to support and resistance levels which will give clear potential entry and exit points for trades.
The second condition is that it must be used with other indicators such as Relative Strength Index (RSI). The RSI confirms where the asset has been overbought and dropped in price which gives the assurance that a bounce is likely. Without such a complimentary indicator, Fibonacci Retracement alone can be misleading and can cost you your capital.
Other indicators to use with Fibonacci Retracement
Like any other indicator, Fibonacci is best used with other indicators. Apart from RSI, other tools that can be used to compliment it are moving averages, volume and other relative strength indicators. Used correctly with the right combinations of these other indicators, Fibonacci Retracement can help to maximize profit and reduce the risk of losing.
Advantage of using Fibonacci Retracement
Fibonacci Retracement is a technical indicator that if used properly can definitively tell a trader when to enter and exit a market with very little chance of losing. Though many find it confusing, it can be very profitable if used correctly in the right scenario.
Disadvantages
Though very reliable, it takes some time to understand this indicator. If not well understood, it can be very risky using it and traders are not advised to use it unless they know exactly what they are doing.
Navigation