What is the Relative Strength Index (RSI)?
There are several indicators used in technical analysis of cryptocurrencies by traders. Before placing a trade and deciding your position and your take profit and stop loss, there is a need to do some analysis to have an idea of what is bound to happen to the asset in the short or long term, depending on the kind of trade you want to place.
Relative Strength Index (RSI) is one of the most commonly used of the indicators used in technical analysis. This article explains what it is and under which circumstances it is used in technical analysis. If you want to learn about it then you are in the right place, so let’s dive in.
RSI explained
RSI falls under a category of indicators called momentum indicators. It is used to judge how much the price of an asset has changed in one direction. RSI ranges from 0 to 100 and can be used to tell the extent of price movement in one direction and what is bound to happen next.
There are two conditions of the price of an asset that are used to tell what is likely to happen next. These are overbought and oversold conditions. When one condition is met, the other is expected to result (ideally). There are however variations as we will see shortly.
What is an overbought RSI condition?
An asset is said to be overbought when it records an RSI of 70 or higher. When this happens, it means that buyers have been in control and have pushed the momentum and by extension the price to a significantly high level. Naturally, some of them will start to sell the asset to take profits, which then causes a reduction in the momentum, and a drop in the price.
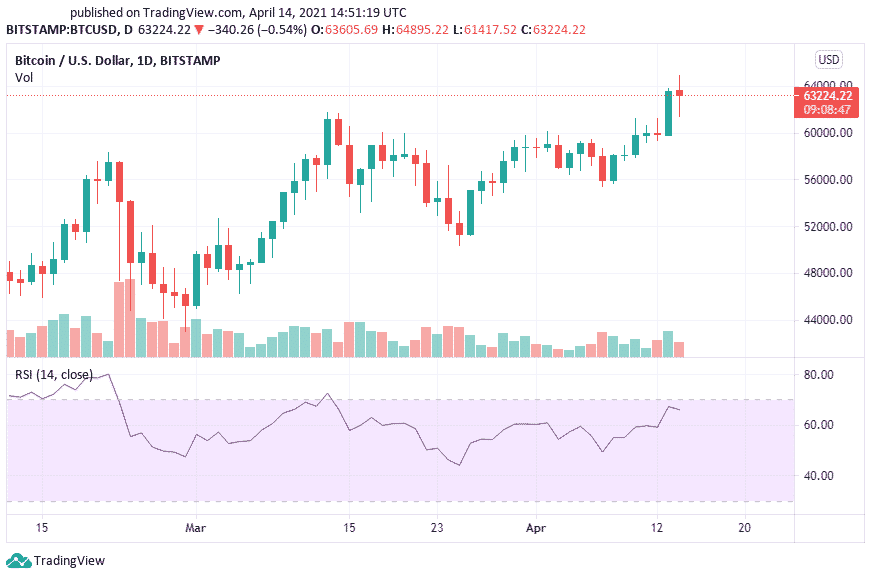
For example, the picture below shows the recent RSI of Bitcoin. The RSI on the screenshot is around 65.90, which means that it is just approaching 70, the level at which is it considered overbought and could be due for a correction.
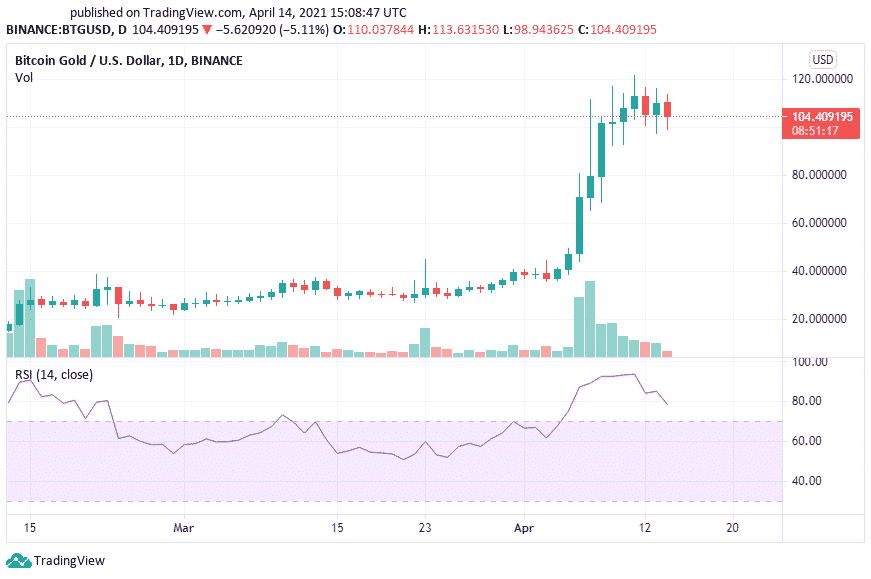
But as mentioned earlier, there are wide variations sometimes. The following chart is that of Bitcoin Gold against the U.S Dollar. The chart shows that the RSI went as high as 95 before a dip. At the moment, it is at 80.72 and will probably drop to lower levels as it is still high. This is typical in a strong bull market.
Oversold RSI condition
An oversold condition is the opposite of overbought. The RSI is considered oversold if it is at 30 or less. Such a condition shows that there has been too much selloff and buyers may soon step in again to turn the momentum to a bullish one once again. The chart below is a typical example of a cryptocurrency in an oversold condition. This condition is not very common with crypto assets, so we will use the gold futures which was oversold recently.
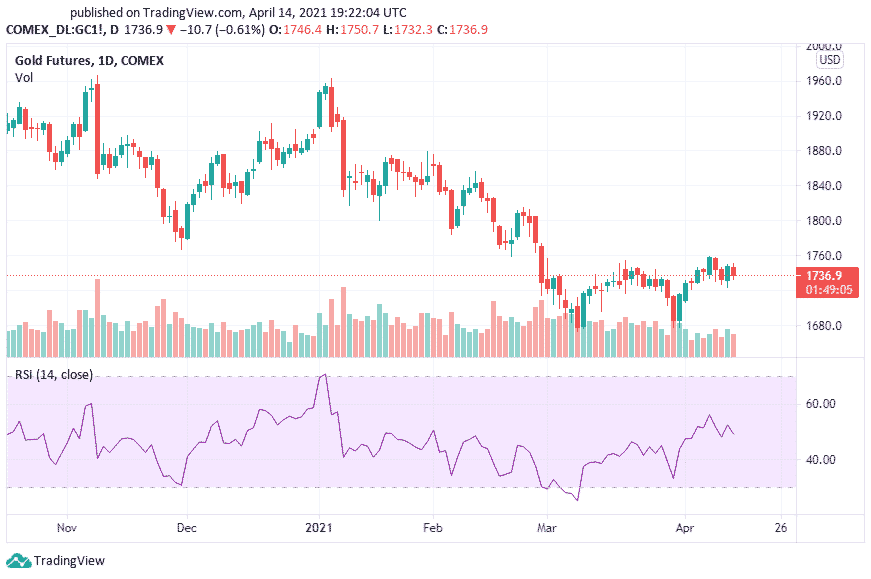
See the point at which the RSI dropped into the white area on March 8? That was a serious oversold that took the RSI to 23. As you can see, from there the momentum picked up once again and has gone up to 50. How far an asset goes in any direction before there is a reversal depends on the particular market of the asset and there are no hard rules.
Other indicators used with RSI
There is hardly any technical indicator that is used in isolation. To get a better picture of the trend, they are usually applied alongside other indicators. For RSI, the best complementary indicator is the Exponential Moving Average (EMA). This indicator tracks the price of an asset over time. It is similar to normal moving average, but gives priority to more recent prices to predict where the market is going.
As priority is given to the most recent price changes, EMA responds more quickly to price changes and so can help to to compliment trend change prediction with the RSI. Used alongside short term crosses of EMAs such as 5 and 10 EMAs can help give a better picture of the direction of the market.
Advantages of using RSI
Technical traders rely a lot on RSI to make trading decisions and for good reason. The first reason is that RSI is a very simple indicator that anyone can read and on the basis of it make informed trading decisions. When used properly, traders can have a good picture of the possible market direction very early on.
Disadvantage of using RSI
While RSI can tell you where the market is likely to head, this is not absolute as there can be exceptions in extreme market conditions. For instance, an RSI of over 70 ideally means the market is overbought, but in an extremely bullish market, this could be the starting point of the upward momentum.
So also, an RSI of less than 30 may not necessarily mean that the trend is about to change and head upward. The RSI can go much lower to even negative values as seen in the gold futures example.
In other words, it only indicates technically but does not actually predict the future of the market.
Navigation