What are Bollinger Bands?
Bollinger Bands are used in technical analysis to determine the market momentum of an asset. It belongs in the same category with RSI, but the approach is different. Bollinger Bands are created using standard positive and negative standard deviations on the upper and lower sides of a Simple Moving Average (SMA).
Bollinger Bands can be calculated using a formula, but I’m not going to bother you with that. Now you have computers that can do that for you with the click of a button. Impressive right? In this article, we will consider what Bollinger Bands are, what they are used for and their advantages and disadvantages. Ready?
Bollinger Bands explained
So what exactly are Bollinger Bands? As mentioned earlier, they are used as momentum indicators. Momentum refers to the strength shown by the price of an asset in a certain direction of movement, basically upward or downward. They were invented by a famous technical trader, John Bollinger in the 1980s for this purpose.
As computers can now be used for technical analysis, Bollinger Bands are calculated by taking the standard deviation (extent of variation from an average value) around the simple SMA of the asset and plotting. Apart from indicating momentum, the bands can also indicate the level of volatility which is rapid changes in price that characterize the crypto market.
This makes it a very suitable indicator for cryptocurrencies.
Which market conditions can you indicate with Bollinger Bands?
So, we know the origin of Bollinger Bands, what they are used for and how they are calculated. But how can you tell the momentum of the market using the indicator? Well, you can tell the momentum of an asset with Bollinger Bands by looking at overbought and oversold conditions. An asset is said to be overbought when the price moves towards the upper band and oversold when the SMA tilts towards the lower band. We will use a few examples to illustrate.
Overbought condition
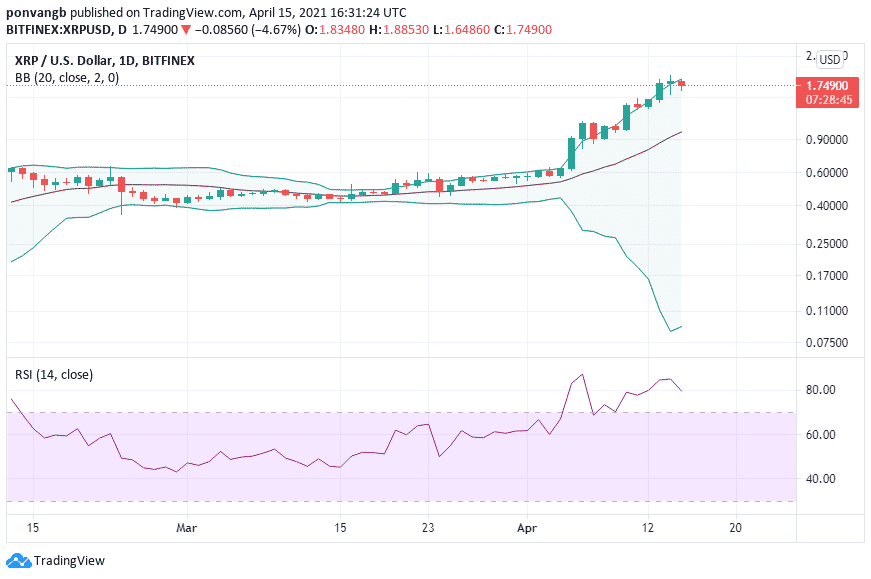
The chart below is a daily chart of XRP price against the U.S Dollar. The price recently surged really fast to new highs last seen in 2018. This is clearly shown in the chart with the steep rise shown at the end of the chart on the right.

As you can see from the chart, the price (SMA) is clearly tilting towards the upper band, suggesting that the asset is overbought. While this shows consistency with the RSI, another momentum indicator which is around 80 showing an overbought condition, the Bollinger bands can sometimes show overbought even when the price of the asset is at the lowest it can be.
Also note that the distance between the bands indicates the level of volatility. A wide gap indicates higher volatility while a narrower gap suggests lower volatility.
Oversold condition
In an oversold condition, the opposite would have been shown. The SMA would tilt downward towards the lower band. This is how to determine an oversold asset from an overbought one and traders use these to inform their decisions on whether to short or to long an asset.
When do you use Bollinger Bands?
As Bollinger Bands give you a good idea of the market momentum and the likely direction of the market, they are used as guides on decisions regarding entry and exit points. For instance if you wish to trade an asset let’s say XRP, the Bollinger Bands tell you that the market is overbought and all things being equal, the next move could be downward. Based on this information, you will probably short the asset (predict that the price will drop).
Bollinger bands also give useful information on volatility by the distance between the bands, remember? Volatility plays a major role in trading. Day traders and swing traders rely heavily on volatility to make money, so a combination of overbought information and high volatility according to XRP’s chart could be a good time to trade. But it is unwise to trade using Bollinger Bands alone as momentum and volatility alone are not sufficient to make trading decisions that will end well. So what other strategies can you use with the bands to get better results?
Other strategies to use with Bollinger Bands
There are two other indicators that can be used with Bollinger Bands to increase the success rates of trades. The first is the moving average. If the market is showing a clear trend such as in an upward or downward trend, 20 moving average can be used to guide on where to place a trade.
The second indicator to use with Bollinger Bands is RSI Divergence. A combination of the two is used to find high probability reversal trades. This means that it is used to determine where to place a trade in anticipation of a trend reversal.
Advantages of Bollinger Bands
Like any other technical indicator, Bollinger Bands have strengths and weaknesses. The major strength is that they are very easy to read. To check overbought or oversold conditions, look where the SMA is pointing. To check volatility, look for where the gap between bands widen and narrow.
Secondly, they are pretty good indicators of how strong prevailing trends are. Greater volatility shows a stronger trend while less volatility shows that the trend is weaker. This guides traders on when to trade and when not to.
Disadvantages
The most talked about disadvantage of the Bollinger Bands is its inability to predict market patterns, but are rather just indicators of the current market conditions. That means alone, you cannot use them to decide on where to enter or exit the market which is why they must be used with other complimentary indicators.
Navigation